On Saturday, February 1, President Trump announced a 25% tariff on all goods imported from Mexico and Canada, and a 10% tariff on goods imported from China.
Stocks sold off the following Monday morning but pared losses after Canada and Mexico made modest concessions and Trump delayed implementation of the tariffs for one month.
Clients may agree or disagree with the President’s approach for various economic and non-economic reasons.
From our perspective, let’s view events through a very narrow lens: the impact on investors and financial markets.
Investors and financial markets view trade barriers as an impediment to economic growth.
- Tariffs could boost inflation, at least in the shorter term.
- Tariffs may slow economic growth as trading partners erect walls to U.S. exports.
- Economic uncertainty arises and hampers business confidence and capital spending.
Yet, after President’s Day, the NASDAQ traded back above 20,000, and the S&P 500 Index a new high.
In essence, investors don’t believe the President will follow through on his threat to sharply lift tariffs on major U.S. trading partners. Instead, they view it as a strategy to gain concessions.
In other words, the market has a glass-half-full attitude.
Meanwhile, powerful tailwinds remain in place.
- The economy is expanding.
- Corporate profits are strong (Q4 S&P 500 profits are forecast to rise 15.3%, LSEG as of February 14 with 76% of firms having reported).
- Investors are absorbing the notion that the Fed is not in a hurry to cut interest rates and has currently shut the door to a resumption of rate hikes.
However, the 30-day deadline for Canada and Mexico expires in March, and the President is threatening reciprocity as soon as April.
Headline risks shouldn’t be discounted, but market volatility has been minimal given the possibility of a full-blown trade war.
1. Trade data
- The 2024 trade deficit set new records with these nations:
- Mexico ($172 billion)
- Vietnam ($123 billion)
- Ireland ($87 billion)
- Germany ($85 billion)
- Taiwan ($74 billion)
- South Korea ($66 billion)
- India ($46 billion)
- The U.S. had record imports (goods) from 50 countries in 2024, led by
- Mexico ($506 billion)
- Germany ($160 billion)
- Japan ($148 billion).
- The U.S. had record exports (goods) to 41 countries in 2024, led by
- Mexico ($334 billion)
- the Netherlands ($90 billion)
- the United Kingdom ($80 billion).
- Top U.S. importers:
- Mexico ($506 billion)
- China ($439 billion)
- Canada ($413 billion)
- Germany ($160 billion)
- The top four countries accounted for 46% of U.S. goods imports.
- Total goods imports: $3.3 trillion
- Top U.S. exporters:
- Canada ($394 billion)
- Mexico ($334 billion)
- China $144 billion) and
- the Netherlands ($90 billion)
- The top four countries accounted for 44% of U.S. goods exports.
- Total goods exports: $2.1 trillion
2. CPI: An unnerving calendar event
- The Consumer Price Index rose 0.5% in January, with food up 0.4% and energy up 1.1%.
- Year-over-year (y/y), headline is up 3.0% in January versus 2.9% in December.
- The core CPI rose a higher-than-expected 0.4% (0.446%, a whisker away from a 0.5% print).
- It was the biggest increase since April 2023.
- The y/y core CPI was up 3.3% in January versus 3.2% in December.
- Progress on core inflation has stalled.
- Core inflation has been stuck between 3.2% and 3.3% for eight months.
Figure 1: Progress Stalls
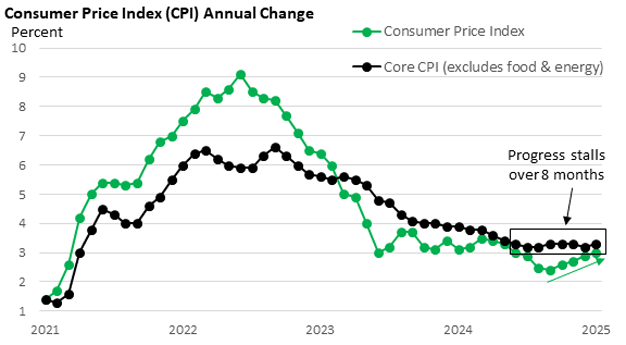
Data Source: U.S. BLS Jan 2025
- Analysts had anticipated a 0.3% rise in the core CPI, so they were taken aback by the larger-than-expected increase, which is particularly surprising given that recent trends strongly suggested we would encounter a substantial rise in January.
- More in a moment.
First, let’s review key components.
- Core consumer goods, which exclude food and energy, rose 0.3% in January versus 0.0% in December.
- Core goods (year-over-year) y/y are down 0.1% versus down 0.7% in December.
- While we’re not experiencing inflation in core goods, the deflationary trend appears to have run its course.
- Services less utilities rose 0.5% in January versus 0.3% in December.
- Services slowed to 4.2% y/y in January versus 4.4%.
- Services inflation continues to moderate.
- Within the services category, shelter rose 0.4% in January compared to 0.3% in December. Shelter eased to 4.4% y/y from 4.6%.
Should we be worried, or are these simply calendar anomalies, i.e., the calendar effect?
- It’s an impossible question to answer definitively, but given recent history, January’s increase should have been anticipated, in my view.
- Let’s review the data in two data cohorts: 2010–2019 (the last economic expansion) and 2023–2024.
- 2020–2022 is excluded due to economic distortions tied to the pandemic.
- I acknowledge that 2023 and 2024 represent a limited data set, but the past two years are all we have to review (thankfully) in this high-inflation environment.
First, 2010–2019
- Figure 2 highlights the average monthly change in the core CPI for seasonally adjusted (SA) and nonseasonally adjusted (NSA) changes.
- Note the NSA price hikes early in the year. For various reasons, firms use the calendar to raise prices.
Figure 2: Seasonal Anomalies I
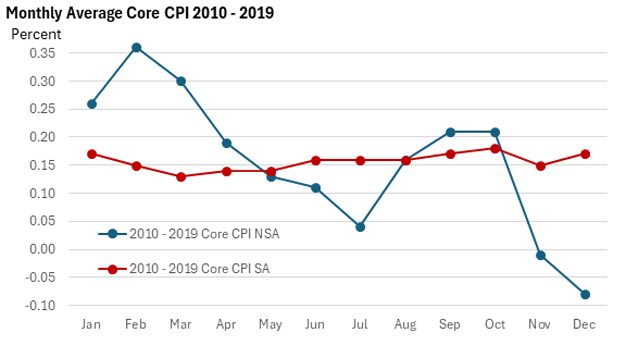
Data Source: U.S. BLS
- Given the low rate of inflation in the 2010s, NSA price increases were much lower early in the year than today. Still, firms used the calendar to lift prices.
- The three biggest months: January, February and March.
- Seasonal adjustments smooth away the nonseasonal lumpiness in the data, allowing the public, investors, and analysts to compare month-to-month data without seasonal distortions.
Second, 2023-2024
- Inflation is much higher today, and front-loaded price hikes are much higher—Figure 3.
- And that translates into much higher SA core inflation early in the year.
- We saw it in 2023.
- We saw it in 2024, which, at the time, gave rise to concerns that inflation was unexpectedly accelerating.
- But SA and NSA numbers slowed sharply by summer.
Figure 3: Seasonal Anomalies II
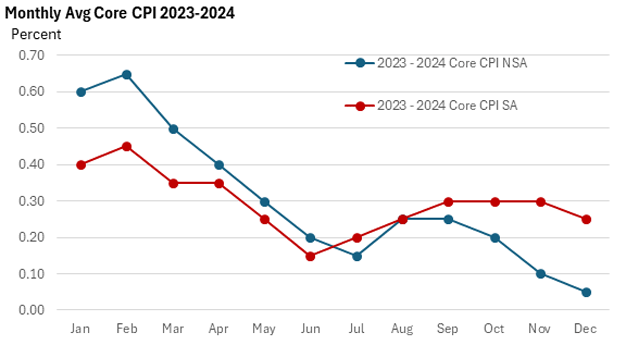
Data Source: U.S. BLS
- The pattern is reasserting itself in the new year, as the core CPI rose 0.57% NSA (0.44% SA).
| Table 1: Monthly Core CPI Quarterly Average | ||||
| Q1 | Q2 | Q3 | Q4 | |
| Quarterly Avg NSA2010-2019 | 0.31% | 0.14 | 0.14 | 0.04 |
| Quarterly Avg NSA2023-2024 | 0.58% | 0.30 | 0.22 | 0.12 |
Data Source: U.S. BLS
- That data in both cohorts strongly suggest that investors should prepare for outsized SA core CPI readings in February, March, and possibly April.
- If seasonality prevails as we move through 2025, monthly inflation should eventually moderate, as we experienced in 2023 and 2024; however, confidence that inflation is headed back to 2% has receded.
Final thoughts
- January’s SA core reading surprised to the upside; in reality, it shouldn’t have been a surprise given the historical trend.
- Ideally, January’s SA core reading would have been below January 2024’s 0.37%. It didn’t.
- Such a level would have signaled that inflation was indeed slowing, even if gradually.
- Some good news: The monthly January 2025 services reading came in below January 2024; hence, the services y/y rate slowed.
- While inflation has slowed significantly from its peak, it remains elevated, and progress has stalled.
- Solid economic growth, coupled with a lack of progress on inflation, reduces the odds of multiple rate cuts this year.
- Per fed funds futures, investors are pricing in one rate cut in 2025, with odds of no rate cuts at 18% as of February 18.
3. No hurry
- At the late January press conference, Fed Chief Powell said the Fed does “not need to be in a hurry to adjust (its) policy stance.”
- He said it five times.
- He repeated it at his semi-annual testimony before two congressional committees last week.
- Fed officials have echoed similar remarks.
- It’s a new year; it’s the Fed’s new catchphrase.
- However, there is no talk of raising rates to help slow economic growth and put downward pressure on inflation.
- The economy is at full employment, and the Fed won’t risk sacrificing half of its mandate (full employment) in order to achieve price stability (2% inflation).
- Policymakers have emphasized that policy is “significantly less restrictive,” though still somewhat restrictive, and the first phase of its recalibration of rates is over.
- If inflation fails to slow, the Fed believes it can achieve price stability by holding rates at the current level for a longer period.
- Of course, the neutral rate can’t be directly observed. It can only be estimated.
- The Fed believes that the neutral rate is around 3%, while others suggest it may be higher.
- If true, the current fed funds rate of 4.25%-4.50% may have little effect on aggregate demand.
- Outside variables such as higher productivity may be needed to slow inflation.
4. Lessons from the 1960s
- Much has been devoted to the mistakes of the 1970s.
- But what about the 1960s?
- Price stability gave way to higher inflation in 1966.
- The Fed helped engineer the perfect soft landing in the mid-1960s, slowing inflation while avoiding a recession.
- A triumph of monetary policy.
- Like today, the Fed cut rates in the 1960s.
- Within two years, the CPI more than doubled to 6%.
- In turn, the Fed chased inflation higher; the fed funds rate peaked at 9% by the end of the decade, which led to a recession in 1970.
Figure 4: Is History Repeating?
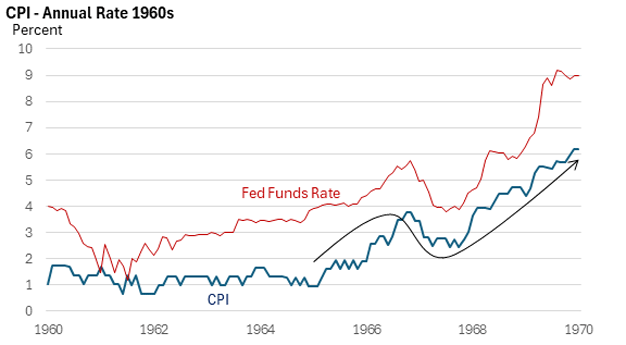
Data Source: St. Louis Federal Reserve
- The government was funding the Vietnam War and social programs in the 1960s: the guns versus butter debate.
- Both supported aggregate demand, and an overheated economy led to much higher inflation.
- Today, geopolitical uncertainties may lead to higher military spending, while government outlays on various priorities (infrastructure, chips, green energy) have risen.
The 1990s
- Economic growth was strong, but inflation slowed as the computer and Internet revolution lifted productivity.
- Could the benefits of AI give a similar boost to productivity, enabling faster, non-inflationary economic growth?
Summary
- There are similarities and differences with the 1960s, but that’s not the baseline case, in my view.
- Still, lessons from the past shouldn’t be forgotten.
- The jury is still out on how AI will affect the economy, and the federal budget is not moving into surplus as it did in the 1990s.
- But AI may have economic benefits that enhance productivity.
– Kevin Theissen, HWC Financial