The S&P 500 Index set an all-time high on February 19. However, optimism quickly faded as investors grew increasingly concerned over trade policy and the economy.
On March 13, the S&P 500 entered its first official correction since 2023, with the index down 10.13%. It’s the first correction since the second half of 2023.
But corrections are normal. Since 1980, the average intra-year pullback for the S&P 500 has been 14%, according to LPL Research.
While corrections introduce uncertainty into investor psychology, they can also be seen as beneficial since they help eliminate excess optimism and speculation that often develops during prolonged periods of low volatility.
As we entered 2025, stocks were priced for perfection: moderate economic growth, rising corporate profits, a pro-business/pro-deregulation administration, and the general belief the Fed would glide rates lower. These were powerful market tailwinds.
Since then, there have been emerging signs that the economy is entering a phase of slower growth. While the Trump Administration continues with its deregulatory efforts, it is also advancing on trade issues, which has created significant uncertainty in investor sentiment.
Moreover, no longer do investors believe that Trump is using the threat of tariffs simply as a tool to lower barriers to U.S. goods. Instead, there is a growing realization that the current administration may be interested in using levies on imported goods as a new source of revenue.
Nonetheless, the likelihood of a recession remains quite low. While terms like stagflation are being bandied around, a growing economy supports earnings, which has cushioned the downside.
1. Theory and a real-life example
- A tariff is a tax on imported goods. It’s a tax collected by the U.S. government from the importer.
- Economic theory: Free trade is a net economic benefit.
- In other words, some win and some lose, but overall, there are more winners than losers.
- Free trade increases the availability of goods and keeps prices down, but domestic industries that can’t compete shed jobs.
- Investors are responding negatively to the potential for broad-based tariffs because tariffs are likely to raise prices, slow economic growth, and increase economic uncertainty—all headwinds for investors.
A history lesson
- In 1930, the Smoot-Hawley Tariff Bill significantly raised tariffs.
- Against the advice of numerous economists, President Hoover signed the bill in June 1930.
- Trading partners retaliated, international trade froze, and the protectionist bill exacerbated the Great Depression—a short and humorous take.
- Senator Smoot and Representative Hawley were voted out of office in 1932.
A modern-day discussion—levies on metals in 2018 on manufacturing jobs
- 3% benefit for producers
- -1.1% reduction due to rising input costs
- -0.7% hit due to retaliation
- Net impact: Manufacturing employment fell 1.4% on net (75k jobs lost) due to higher costs and retaliation (CNBC and Federal Reserve).
- There was a $900,000 cost to consumers per steel job created—Peterson Institute for International Economics
- Jobs using steel outnumber those producing steel by 80 to 1.
- It was a net loss to the economy as the hit to losers exceeded the benefits to winners.
2. Bearish sentiment
- An extremely high level of bearish sentiment has historically coincided with bear market bottoms.
- Bearish sentiment peaked as the S&P 500 bottomed in 1990, 2009, and 2022. (bearish sentiment peaked in early 2003; the market bottomed in October 2002).
Figure 1: The Bulls Disappear
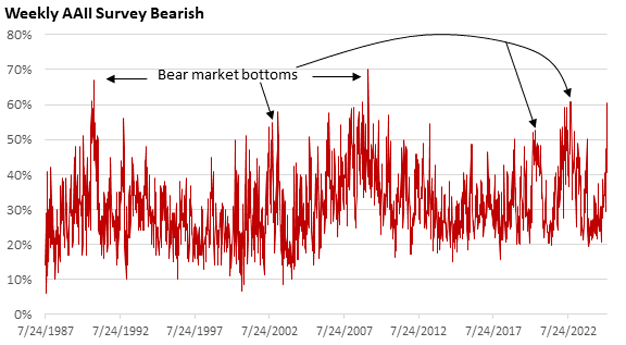
Data Source: AAII 3/13/2025
- But the survey also detected a high level of bears in April and June 2022, well before the end of the 2022 bear market.
- In the week ended October 8, 2008, bearish sentiment hit 60.8%, well in front of the 2009 bottom in March 2009.
- Today, bearish sentiment is at 59.2% (as of 3/13/25), while bullish sentiment has dried up and is at a cycle low of 19.1%, the third straight week below 20%.
- Interestingly, bearish sentiment hit a high of 60.6% as of the week ended February 27, just one week after the S&P 500 Index hit a high.
- Historically, a reading of 60% would suggest capitulation—characterized by large selling pressure.
- Today, the mood turned unusually dark shortly after a market high.
3. The consumer is in focus
- After an upbeat second half of 2024, the outlook for consumer spending has turned hazy.
- Consumer sentiment tumbled to 57.9 in mid-March from 71.7 in January.
Figure 2: A Sour Outlook
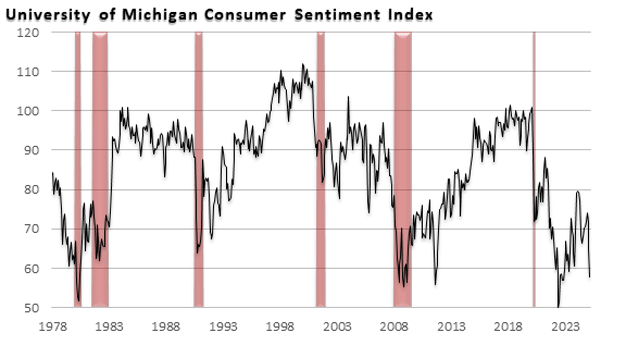
Data Source: St. Louis Federal Reserve, NBER March 2025 Shaded areas mark recessions
- Retail sales, which fell sharply in January, managed a modest increase in February.
- In part, unusually harsh weather in January negatively impacted sales, and the rough conditions continued into February.
- Following a modest downward revision to January’s data (-0.9% to -1.2%), retail sales rose 0.2% in February, well below the consensus of 0.7%.
- But can retail weakness be blamed entirely on weather? Probably not.
- The National Retail Federation president cited “the combination of harsh winter weather and declining consumer confidence” for softness in spending.
- Yet, as Figure 3 illustrates, spending is quite lumpy and can be influenced by many factors, including weather.
Figure 3: Uneven Growth
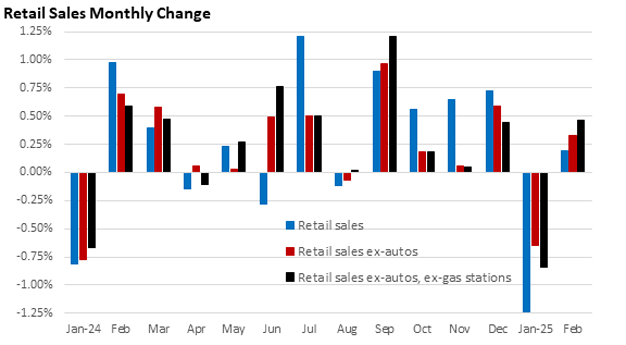
Data Source: U.S. Census Feb 2025
- While the numbers for January and February fell short of expectations, not everything is bleak.
- Taken together, core sales are up eight of the last 10 months.
- The so-called “control group,” which excludes autos, gas stations, building materials, and office supply stores, rose a robust 1.0% in February.
- Sales of online retailers rose 2.5%.
- Yet, several retailers have recently warned or issued tepid outlooks, including Walmart, Costco, McDonald’s, Kohl’s, Macy’s, Dollar General, Dick’s Sporting Goods, Lowe’s, Delta Airlines, American Airlines and Southwest.
- One sign that the economy continues to expand: low and stable first-time jobless claims.
- Claims fell 2,000 for the week ended March 8 to 220,000.
- If the economy were slowing significantly, we’d expect a rise in layoffs and first-time jobless claims.
- Note: Many federal employees who have lost jobs are still on the payrolls; layoffs are reported under a separate program and are not counted in the DOL’s weekly release.
- Meanwhile, U.S.-based employers announced 172,017 job cuts in February, a 245% increase from the 49,795 cuts announced in January, according to the Challenger Report of Announced Job Cuts.
- The combined total of January and February was the highest since 2009.
- Still, Jan.–Feb. 2022 and 2023 announced cuts were also elevated without leading to an unwanted weakening in labor market conditions.
- Many who have received notices have yet to file for weekly benefits.
The ebb and flow of the data
- The economy runs in cycles in the sense that data exceeds expectations for a period followed by underperformance. And the cycle repeats.
- The Citigroup Surprise Index represents the sum of the difference between official economic reports and forecasts.
- Readings above zero: overall, the data is topping forecasts.
- Readings below zero: overall, the data is failing to meet expectations.
Figure 4: A Rollercoaster Ride
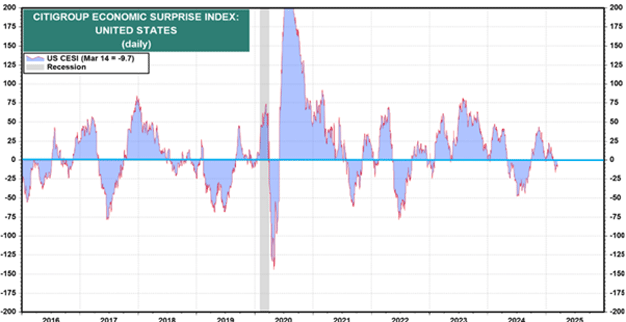
Source: LSEG DataStream and Yardeni Research, and Citigroup
- The index has turned negative.
A negative Q1 GDP?
- Notably, the Atlanta Fed’s GDPNow model is tracking at -1.8% as of March 18.
- Blame technical factors.
- U.S. imports have soared as companies and purchasing managers hope to get ahead of expected tariffs.
- In January (latest data available), U.S. imports of goods surged by $36.2 billion to $329.5 billion in January.
- Rising imports detract from GDP.
- Prior to the January trade report, GDP was tracking at 2.3%.
- As trade flows even out, imports are expected to decline, artificially and temporarily supporting GDP.
4. The CPI comes in under forecasts
- Early-year readings have disappointed recently amid what might be called the calendar effect—companies raising prices in the new year.
- February, however, was a pleasant surprise.
- The CPI and the core CPI both rose 0.2% in February.
- Year-over-year (y/y), the CPI slowed from 3.0% in January to 2.8% in February.
- The core CPI slowed from 3.3% y/y to 3.1% y/y, the slowest pace since April 2021.
- The core CPI has been stuck between 3.2% and 3.3% for eight straight months.
Behind the trends
- Inflation in services continues to ease, falling from 4.1% to 4.0% y/y, the lowest since December 2021.
- Shelter continues to moderate, with owner’s equivalent of residences rising 0.3% in February, the fourth such monthly increase in a row.
- Between 2013 and 2019, services averaged 2.6% y/y. As such, today’s 4.0% is elevated.
- Core consumer goods, which excludes food and energy, has been well-behaved, but the deflationary trend has run its course, as reflected in Figure 5.
- Between 2013 and 2019, core consumer goods averaged -0.3% y/y.
Figure 5: Two Key CPI Categories
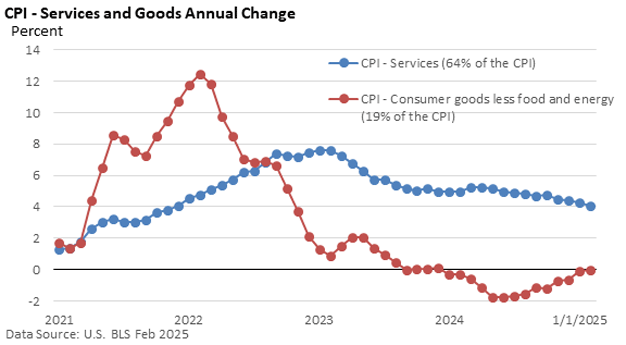
Data Source: U.S. BLS Feb 2025
- The Fed’s longer-run target is 2% (PCE Price Index).
- The mix isn’t as important as the headline number.
- Given that progress on inflation has slowed significantly, the Fed has signaled that it’s in no hurry to cut interest rates.
- “Despite elevated levels of uncertainty, the U.S. economy continues to be in a good place,” Powell said in prepared remarks on March 7.
- Such a comment signals the Fed is on hold right now.
- He repeated that the Fed does “not need to be in a hurry,” adding that policymakers “are well-positioned to wait for greater clarity.”
- That said, the Fed can hold rates at the current level until inflation returns to its downward trend, barring unforeseen economic weakness.
- Although the conventional wisdom suggests that tariffs are a one-time boost to prices, the Fed may hold off on rate cuts as it monitors the potential for residual price hikes tied to tariffs, i.e., let’s call them “echo price hikes.”
- Recall that the Fed was burned with its insistence that the early burst of inflation in 2021 was “transitory.”
- It doesn’t want to make that mistake again.
- Additionally, discussions of tariffs are influencing consumer psychology, as expectations for inflation have risen sharply.
- The Fed keeps closer tabs on five-year expectations, which, at 3.9%, is the highest level since 1993.
Figure 6: Consumers Anticipate a Rise in Inflation
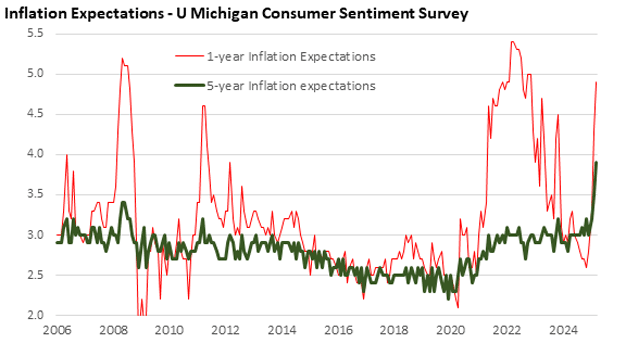
Data Source: Univ of Michigan March 2025
- Market-based expectations, however, have been steady.
- As of March 17, the 10-year breakeven rate is 2.29%.